Note
Go to the end to download the full example code.
Quadkey and S2 Grid Systems Demonstration.#
This example showcases the new Quadkey and S2 grid systems added to M3S, demonstrating their unique properties and use cases.
M3S: Quadkey and S2 Grid Systems
Advanced Spatial Indexing Demonstration
============================================================
QUADKEY GRID SYSTEM DEMONSTRATION
============================================================
Test point: New York City (40.7128, -74.006)
Quadkey properties at different levels:
/home/runner/work/m3s/m3s/examples/quadkey_s2_example.py:32: DeprecationWarning: The 'level' parameter is deprecated. Use 'precision' instead.
grid = QuadkeyGrid(level=level)
Level 8: Quadkey='03201011' | Size~1.0702deg x 1.4062deg | Length=8
Level 12: Quadkey='032010110301' | Size~0.0667deg x 0.0879deg | Length=12
Level 16: Quadkey='0320101103011111' | Size~0.0042deg x 0.0055deg | Length=16
Quadkey Hierarchical Properties:
/home/runner/work/m3s/m3s/examples/quadkey_s2_example.py:48: DeprecationWarning: The 'level' parameter is deprecated. Use 'precision' instead.
grid = QuadkeyGrid(level=12)
Parent cell: 032010110301
Children: ['0320101103010', '0320101103011', '0320101103012', '0320101103013']
Children start with parent quadkey: True
Number of neighbors: 8
============================================================
S2 GRID SYSTEM DEMONSTRATION
============================================================
Test point: New York City (40.7128, -74.006)
S2 properties at different levels:
Level 8: Token='89c25' | Area~0.11912978deg | Token Length=5
Level 12: Token='89c25a3' | Area~0.00046488deg | Token Length=7
Level 16: Token='89c25a221' | Area~0.00000182deg | Token Length=9
S2 Hierarchical Properties:
Cell token: 89c25a3
Number of children: 4
Sample child tokens: ['89c25a24', '89c25a2c']
Parent token: 89c25a4
Number of neighbors: 4
============================================================
QUADKEY vs S2 COMPARISON
============================================================
/home/runner/work/m3s/m3s/examples/quadkey_s2_example.py:141: DeprecationWarning: The 'level' parameter is deprecated. Use 'precision' instead.
quadkey_grid = QuadkeyGrid(level=14) # ~600m tiles
/home/runner/work/m3s/m3s/examples/quadkey_s2_example.py:142: DeprecationWarning: The 'level' parameter is deprecated. Use 'precision' instead.
s2_grid = S2Grid(level=12) # ~300m cells
Processing intersections...
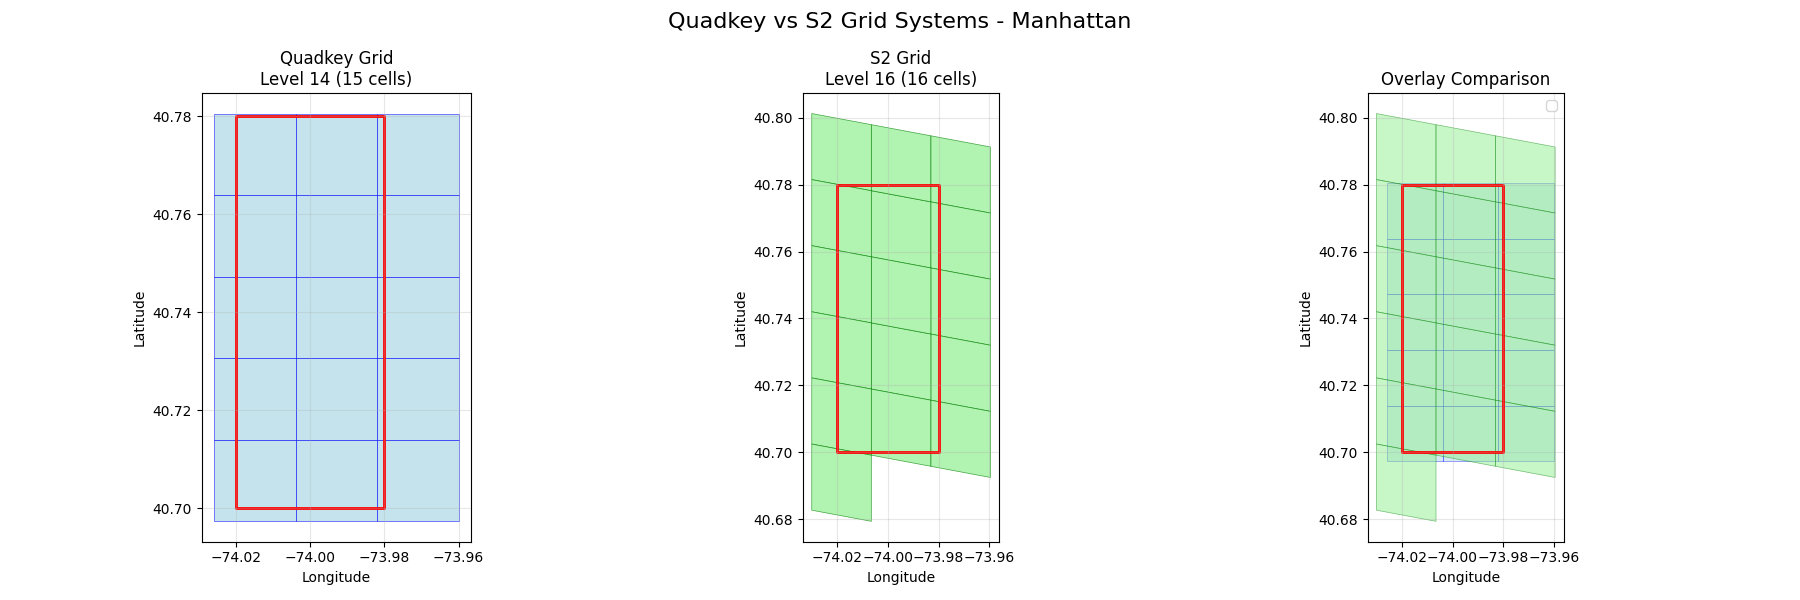
Quadkey (level 14): 15 cells
S2 (level 16): 16 cells
/home/runner/work/m3s/m3s/examples/quadkey_s2_example.py:210: UserWarning: Legend does not support handles for PatchCollection instances.
See: https://matplotlib.org/stable/tutorials/intermediate/legend_guide.html#implementing-a-custom-legend-handler
ax3.legend()
/home/runner/work/m3s/m3s/examples/quadkey_s2_example.py:210: UserWarning: No artists with labels found to put in legend. Note that artists whose label start with an underscore are ignored when legend() is called with no argument.
ax3.legend()
============================================================
SPATIAL PROPERTIES ANALYSIS
============================================================
Analyzing grid cell identifiers for global points:
------------------------------------------------------------
/home/runner/work/m3s/m3s/examples/quadkey_s2_example.py:236: DeprecationWarning: The 'level' parameter is deprecated. Use 'precision' instead.
quadkey_grid = QuadkeyGrid(level=10)
/home/runner/work/m3s/m3s/examples/quadkey_s2_example.py:237: DeprecationWarning: The 'level' parameter is deprecated. Use 'precision' instead.
s2_grid = S2Grid(level=10)
New York | Quadkey: 0320101103 | S2: 89c25b | QK Area: 0.093870 | S2 Area: 0.007442
London | Quadkey: 0313131311 | S2: 487605 | QK Area: 0.076926 | S2 Area: 0.007898
Tokyo | Quadkey: 1330021123 | S2: 6018f3 | QK Area: 0.100491 | S2 Area: 0.005990
Sydney | Quadkey: 3112301330 | S2: 6b12af | QK Area: 0.102622 | S2 Area: 0.007633
Mexico City | Quadkey: 0233100332 | S2: 85d1ff | QK Area: 0.116523 | S2 Area: 0.008349
============================================================
USE CASE DEMONSTRATIONS
============================================================
1. Quadkey Use Cases:
- Web mapping and tile serving (Bing Maps)
- Hierarchical spatial indexing
- Database optimization with string keys
- Cache-friendly tile loading
- Simple spatial queries
2. S2 Use Cases:
- Large-scale geospatial analysis (Google Maps)
- Global spatial indexing
- Spherical geometry calculations
- Location-based services
- Scientific geospatial applications
3. Performance Characteristics:
Quadkey:
- Fast string-based operations
- Efficient for rectangular regions
- Simple hierarchy traversal
- Good for web applications
S2:
- Optimal spatial locality
- Excellent for spherical calculations
- Complex but powerful covering algorithms
- Best for large-scale scientific applications
============================================================
SUMMARY
============================================================
+ Quadkey Grid System: Microsoft's tile-based spatial indexing
+ S2 Grid System: Google's spherical geometry library
+ Both systems offer unique advantages for different applications
+ M3S provides unified interface for both systems
Installation Notes:
- Quadkey: No additional dependencies (pure Python implementation)
- S2: Optional s2sphere library for full functionality
- Install with: pip install s2sphere
- Falls back to simplified implementation if not available
import warnings

import geopandas as gpd
import matplotlib.pyplot as plt
from shapely.geometry import box

from m3s import QuadkeyGrid, S2Grid


def demonstrate_quadkey():
    """Demonstrate Quadkey grid system features."""
    print("=" * 60)
    print("QUADKEY GRID SYSTEM DEMONSTRATION")
    print("=" * 60)

    # Create Quadkey grids at different levels
    levels = [8, 12, 16]
    test_point = (40.7128, -74.0060)  # NYC

    print(f"Test point: New York City {test_point}")
    print("\nQuadkey properties at different levels:")

    for level in levels:
        grid = QuadkeyGrid(level=level)
        cell = grid.get_cell_from_point(test_point[0], test_point[1])

        # Calculate approximate cell size
        bounds = grid.get_quadkey_bounds(cell.identifier)
        lat_size = bounds[2] - bounds[0]  # max_lat - min_lat
        lon_size = bounds[3] - bounds[1]  # max_lon - min_lon

        print(
            f"  Level {level:2d}: Quadkey='{cell.identifier}' | "
            f"Size~{lat_size:.4f}deg x {lon_size:.4f}deg | "
            f"Length={len(cell.identifier)}"
        )

    # Demonstrate hierarchical properties
    print("\nQuadkey Hierarchical Properties:")
    grid = QuadkeyGrid(level=12)
    cell = grid.get_cell_from_point(test_point[0], test_point[1])

    print(f"Parent cell: {cell.identifier}")

    # Get children
    children = grid.get_children(cell)
    print(f"Children: {[child.identifier for child in children]}")

    # Show that children start with parent quadkey
    children_match = all(
        child.identifier.startswith(cell.identifier) for child in children
    )
    print(f"Children start with parent quadkey: {children_match}")

    # Get neighbors
    neighbors = grid.get_neighbors(cell)
    print(f"Number of neighbors: {len(neighbors)}")

    return grid, cell


def demonstrate_s2():
    """Demonstrate S2 grid system features."""
    print("\n" + "=" * 60)
    print("S2 GRID SYSTEM DEMONSTRATION")
    print("=" * 60)

    # Suppress warnings for cleaner output
    with warnings.catch_warnings():
        warnings.simplefilter("ignore")

        # Create S2 grids at different levels
        levels = [8, 12, 16]
        test_point = (40.7128, -74.0060)  # NYC

        print(f"Test point: New York City {test_point}")
        print("\nS2 properties at different levels:")

        cells_by_level = {}
        for level in levels:
            grid = S2Grid(level=level)
            cell = grid.get_cell_from_point(test_point[0], test_point[1])
            cells_by_level[level] = cell

            # Calculate approximate cell area
            area = cell.polygon.area

            print(
                f"  Level {level:2d}: Token='{cell.identifier}' | "
                f"Area~{area:.8f}deg | "
                f"Token Length={len(cell.identifier)}"
            )

        # Demonstrate hierarchical properties
        print("\nS2 Hierarchical Properties:")
        grid = S2Grid(level=12)
        cell = grid.get_cell_from_point(test_point[0], test_point[1])

        print(f"Cell token: {cell.identifier}")

        # Get children
        children = grid.get_children(cell)
        print(f"Number of children: {len(children)}")
        if children:
            child_ids = [child.identifier for child in children[:2]]
            print(f"Sample child tokens: {child_ids}")

        # Get parent
        parent = grid.get_parent(cell)
        if parent:
            print(f"Parent token: {parent.identifier}")

        # Get neighbors
        neighbors = grid.get_neighbors(cell)
        print(f"Number of neighbors: {len(neighbors)}")

        return grid, cell


def compare_grid_systems():
    """Compare Quadkey and S2 grid systems side by side."""
    print("\n" + "=" * 60)
    print("QUADKEY vs S2 COMPARISON")
    print("=" * 60)

    # Test area around Manhattan
    test_area = box(-74.02, 40.70, -73.98, 40.78)
    test_gdf = gpd.GeoDataFrame(
        {"name": ["Manhattan"]}, geometry=[test_area], crs="EPSG:4326"
    )

    # Create grids with similar resolutions
    quadkey_grid = QuadkeyGrid(level=14)  # ~600m tiles
    s2_grid = S2Grid(level=12)  # ~300m cells

    print("Processing intersections...")

    # Get intersections
    with warnings.catch_warnings():
        warnings.simplefilter("ignore")
        quadkey_result = quadkey_grid.intersects(test_gdf)
        s2_result = s2_grid.intersects(test_gdf)

    print(f"Quadkey (level 14): {len(quadkey_result)} cells")
    print(f"S2 (level 16): {len(s2_result)} cells")

    # Create visualization
    fig, axes = plt.subplots(1, 3, figsize=(18, 6))
    fig.suptitle("Quadkey vs S2 Grid Systems - Manhattan", fontsize=16)

    # Plot Quadkey
    ax1 = axes[0]
    ax1.set_title(f"Quadkey Grid\nLevel 14 ({len(quadkey_result)} cells)")
    if len(quadkey_result) > 0:
        quadkey_result.plot(
            ax=ax1, facecolor="lightblue", edgecolor="blue", linewidth=0.5, alpha=0.7
        )
    test_gdf.plot(ax=ax1, facecolor="none", edgecolor="red", linewidth=2)
    ax1.set_xlabel("Longitude")
    ax1.set_ylabel("Latitude")
    ax1.grid(True, alpha=0.3)

    # Plot S2
    ax2 = axes[1]
    ax2.set_title(f"S2 Grid\nLevel 16 ({len(s2_result)} cells)")
    if len(s2_result) > 0:
        s2_result.plot(
            ax=ax2, facecolor="lightgreen", edgecolor="green", linewidth=0.5, alpha=0.7
        )
    test_gdf.plot(ax=ax2, facecolor="none", edgecolor="red", linewidth=2)
    ax2.set_xlabel("Longitude")
    ax2.set_ylabel("Latitude")
    ax2.grid(True, alpha=0.3)

    # Plot overlay
    ax3 = axes[2]
    ax3.set_title("Overlay Comparison")
    if len(quadkey_result) > 0:
        quadkey_result.plot(
            ax=ax3,
            facecolor="lightblue",
            edgecolor="blue",
            linewidth=0.5,
            alpha=0.5,
            label="Quadkey",
        )
    if len(s2_result) > 0:
        s2_result.plot(
            ax=ax3,
            facecolor="lightgreen",
            edgecolor="green",
            linewidth=0.5,
            alpha=0.5,
            label="S2",
        )
    test_gdf.plot(
        ax=ax3, facecolor="none", edgecolor="red", linewidth=2, label="Test Area"
    )
    ax3.set_xlabel("Longitude")
    ax3.set_ylabel("Latitude")
    ax3.grid(True, alpha=0.3)
    ax3.legend()

    plt.tight_layout()
    plt.show()

    return quadkey_result, s2_result


def analyze_spatial_properties():
    """Analyze spatial properties of different grid systems."""
    print("\n" + "=" * 60)
    print("SPATIAL PROPERTIES ANALYSIS")
    print("=" * 60)

    # Test points around the world
    test_points = [
        (40.7128, -74.0060, "New York"),
        (51.5074, -0.1278, "London"),
        (35.6762, 139.6503, "Tokyo"),
        (-33.8688, 151.2093, "Sydney"),
        (19.4326, -99.1332, "Mexico City"),
    ]

    print("Analyzing grid cell identifiers for global points:")
    print("-" * 60)

    quadkey_grid = QuadkeyGrid(level=10)
    s2_grid = S2Grid(level=10)

    results = []
    for lat, lon, city in test_points:
        quadkey_cell = quadkey_grid.get_cell_from_point(lat, lon)

        with warnings.catch_warnings():
            warnings.simplefilter("ignore")
            s2_cell = s2_grid.get_cell_from_point(lat, lon)

        results.append(
            {
                "city": city,
                "lat": lat,
                "lon": lon,
                "quadkey_id": quadkey_cell.identifier,
                "quadkey_area": quadkey_cell.polygon.area,
                "s2_id": s2_cell.identifier,
                "s2_area": s2_cell.polygon.area,
            }
        )

    for result in results:
        print(
            f"{result['city']:12} | "
            f"Quadkey: {result['quadkey_id']:12} | "
            f"S2: {result['s2_id']:12} | "
            f"QK Area: {result['quadkey_area']:.6f} | "
            f"S2 Area: {result['s2_area']:.6f}"
        )

    return results


def demonstrate_use_cases():
    """Demonstrate typical use cases for each grid system."""
    print("\n" + "=" * 60)
    print("USE CASE DEMONSTRATIONS")
    print("=" * 60)

    print("1. Quadkey Use Cases:")
    print("   - Web mapping and tile serving (Bing Maps)")
    print("   - Hierarchical spatial indexing")
    print("   - Database optimization with string keys")
    print("   - Cache-friendly tile loading")
    print("   - Simple spatial queries")

    print("\n2. S2 Use Cases:")
    print("   - Large-scale geospatial analysis (Google Maps)")
    print("   - Global spatial indexing")
    print("   - Spherical geometry calculations")
    print("   - Location-based services")
    print("   - Scientific geospatial applications")

    print("\n3. Performance Characteristics:")
    print("   Quadkey:")
    print("     - Fast string-based operations")
    print("     - Efficient for rectangular regions")
    print("     - Simple hierarchy traversal")
    print("     - Good for web applications")

    print("   S2:")
    print("     - Optimal spatial locality")
    print("     - Excellent for spherical calculations")
    print("     - Complex but powerful covering algorithms")
    print("     - Best for large-scale scientific applications")


def main():
    """Run main demonstration."""
    print("M3S: Quadkey and S2 Grid Systems")
    print("Advanced Spatial Indexing Demonstration")

    # Individual demonstrations
    quadkey_grid, quadkey_cell = demonstrate_quadkey()
    s2_grid, s2_cell = demonstrate_s2()

    # Comparative analysis
    quadkey_result, s2_result = compare_grid_systems()
    analyze_spatial_properties()

    # Use case explanation
    demonstrate_use_cases()

    print("\n" + "=" * 60)
    print("SUMMARY")
    print("=" * 60)
    print("+ Quadkey Grid System: Microsoft's tile-based spatial indexing")
    print("+ S2 Grid System: Google's spherical geometry library")
    print("+ Both systems offer unique advantages for different applications")
    print("+ M3S provides unified interface for both systems")

    print("\nInstallation Notes:")
    print("- Quadkey: No additional dependencies (pure Python implementation)")
    print("- S2: Optional s2sphere library for full functionality")
    print("  - Install with: pip install s2sphere")
    print("  - Falls back to simplified implementation if not available")


if __name__ == "__main__":
    # Suppress matplotlib font warnings
    warnings.filterwarnings("ignore", category=UserWarning, module="matplotlib")

    main()
Total running time of the script: (0 minutes 0.764 seconds)